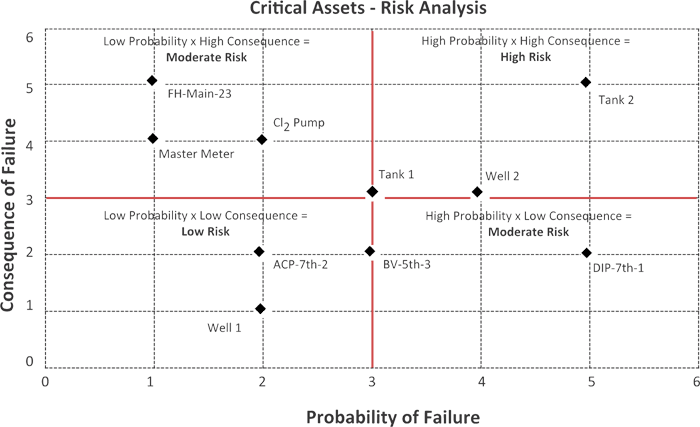
The highest risk numbers will fall in the box in the upper right-hand corner, making it easy to compare assets and determine which of the assets are most critical. An example is shown above that includes assets in each of the quadrants of the chart. This example assumes that redundancy has been taken into account in the consequence of failure rating. A blank quad chart is included in Appendix C.
There is another way to consider redundancy. In this approach, the probability score is multiplied by the consequence score and then by a redundancy factor. The redundancy factor is based on how much redundancy there is for the asset. For example, if there are three pumps and two are needed to operate at a time, the utility has a 50 percent redundancy in pumps. If there are four pumps and three are needed, the utility has 33% redundancy. If there are two pumps and only one is needed, there is 100% redundancy. If there are three pumps and only one is needed, there is 200% redundancy.
An example of how to calculate the risk ranking using this approach follows.
A pump is rated 4 for probability of failure and 4 for consequence of failure. There are 3 pumps and 2 must be operating at any one time. (50% redundancy)
Criticality = (probability rating) times (consequence rating) times (1 minus redundancy factor expressed as a decimal)
Criticality = 4 X 4 X (1 - 0.5) = 8
Note that without redundancy, the asset would have had a score of 16.
If the redundancy is 100% or more, the equation would give an answer of 0 or negative risk. However, this does not represent the true risk, because even with redundant assets, there is still some risk related to the asset because the redundant assets must perform as expected. Therefore, for any asset that has a redundancy of 100% or more, a consequence rating of 1 should be used.


